Showing posts with label distressed properties. Show all posts

Friday, January 12, 2018

The supply of distressed housing has dramatically decreased, however that is not having a negative impact on the affordability of the housing market.

2 Charts That Show the Truth about Home Affordability

2 Charts That Show the Truth about Home Affordability | MyKCM
There is a lot of discussion about the current state of housing affordability for both first-time and move-up buyers, and much of the narrative is tarnished with a negative slant. However, the truth is that housing affordability is better today than at almost any time in our history.
The naysayers are correct in the fact that affordability today is not as good as it has been over the last several years. But, we must remember that home prices collapsed during the housing crash, and distressed properties (foreclosures and short sales) kept home values depressed for years. When we compare affordability to the decades that proceeded the crash, a different story is revealed.
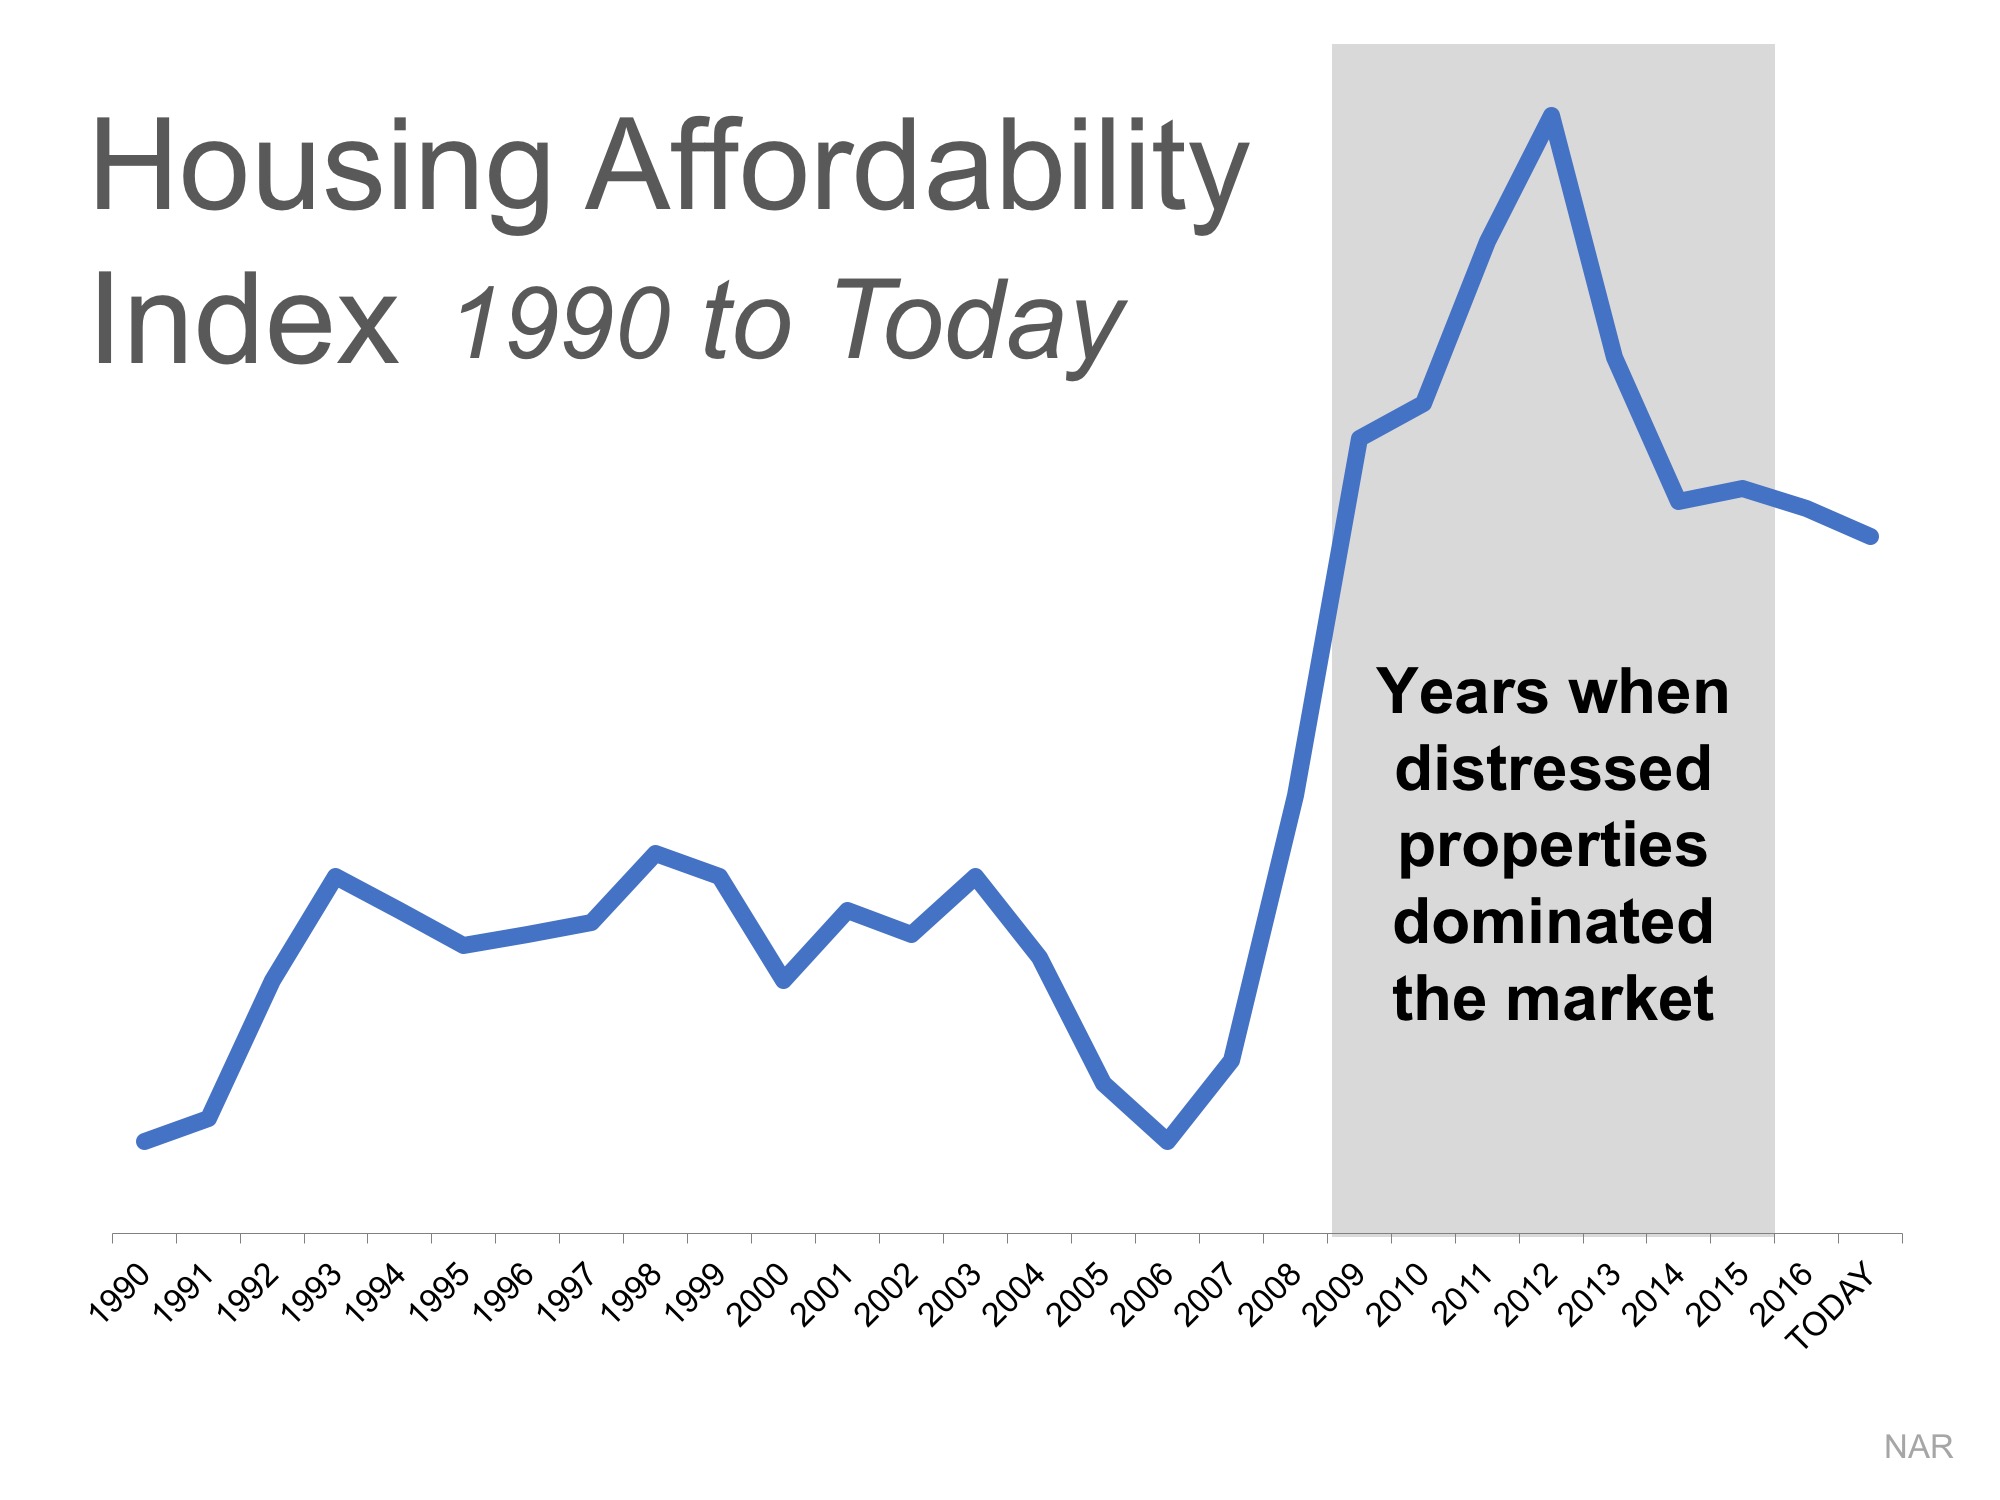
Here is a graph of the National Association of Realtors’ Housing Affordability Index. The higher the graph, the more affordable homes are.
2 Charts That Show the Truth about Home Affordability | MyKCM
We can see that affordability is better today than in the fifteen years prior to the boom and bust.
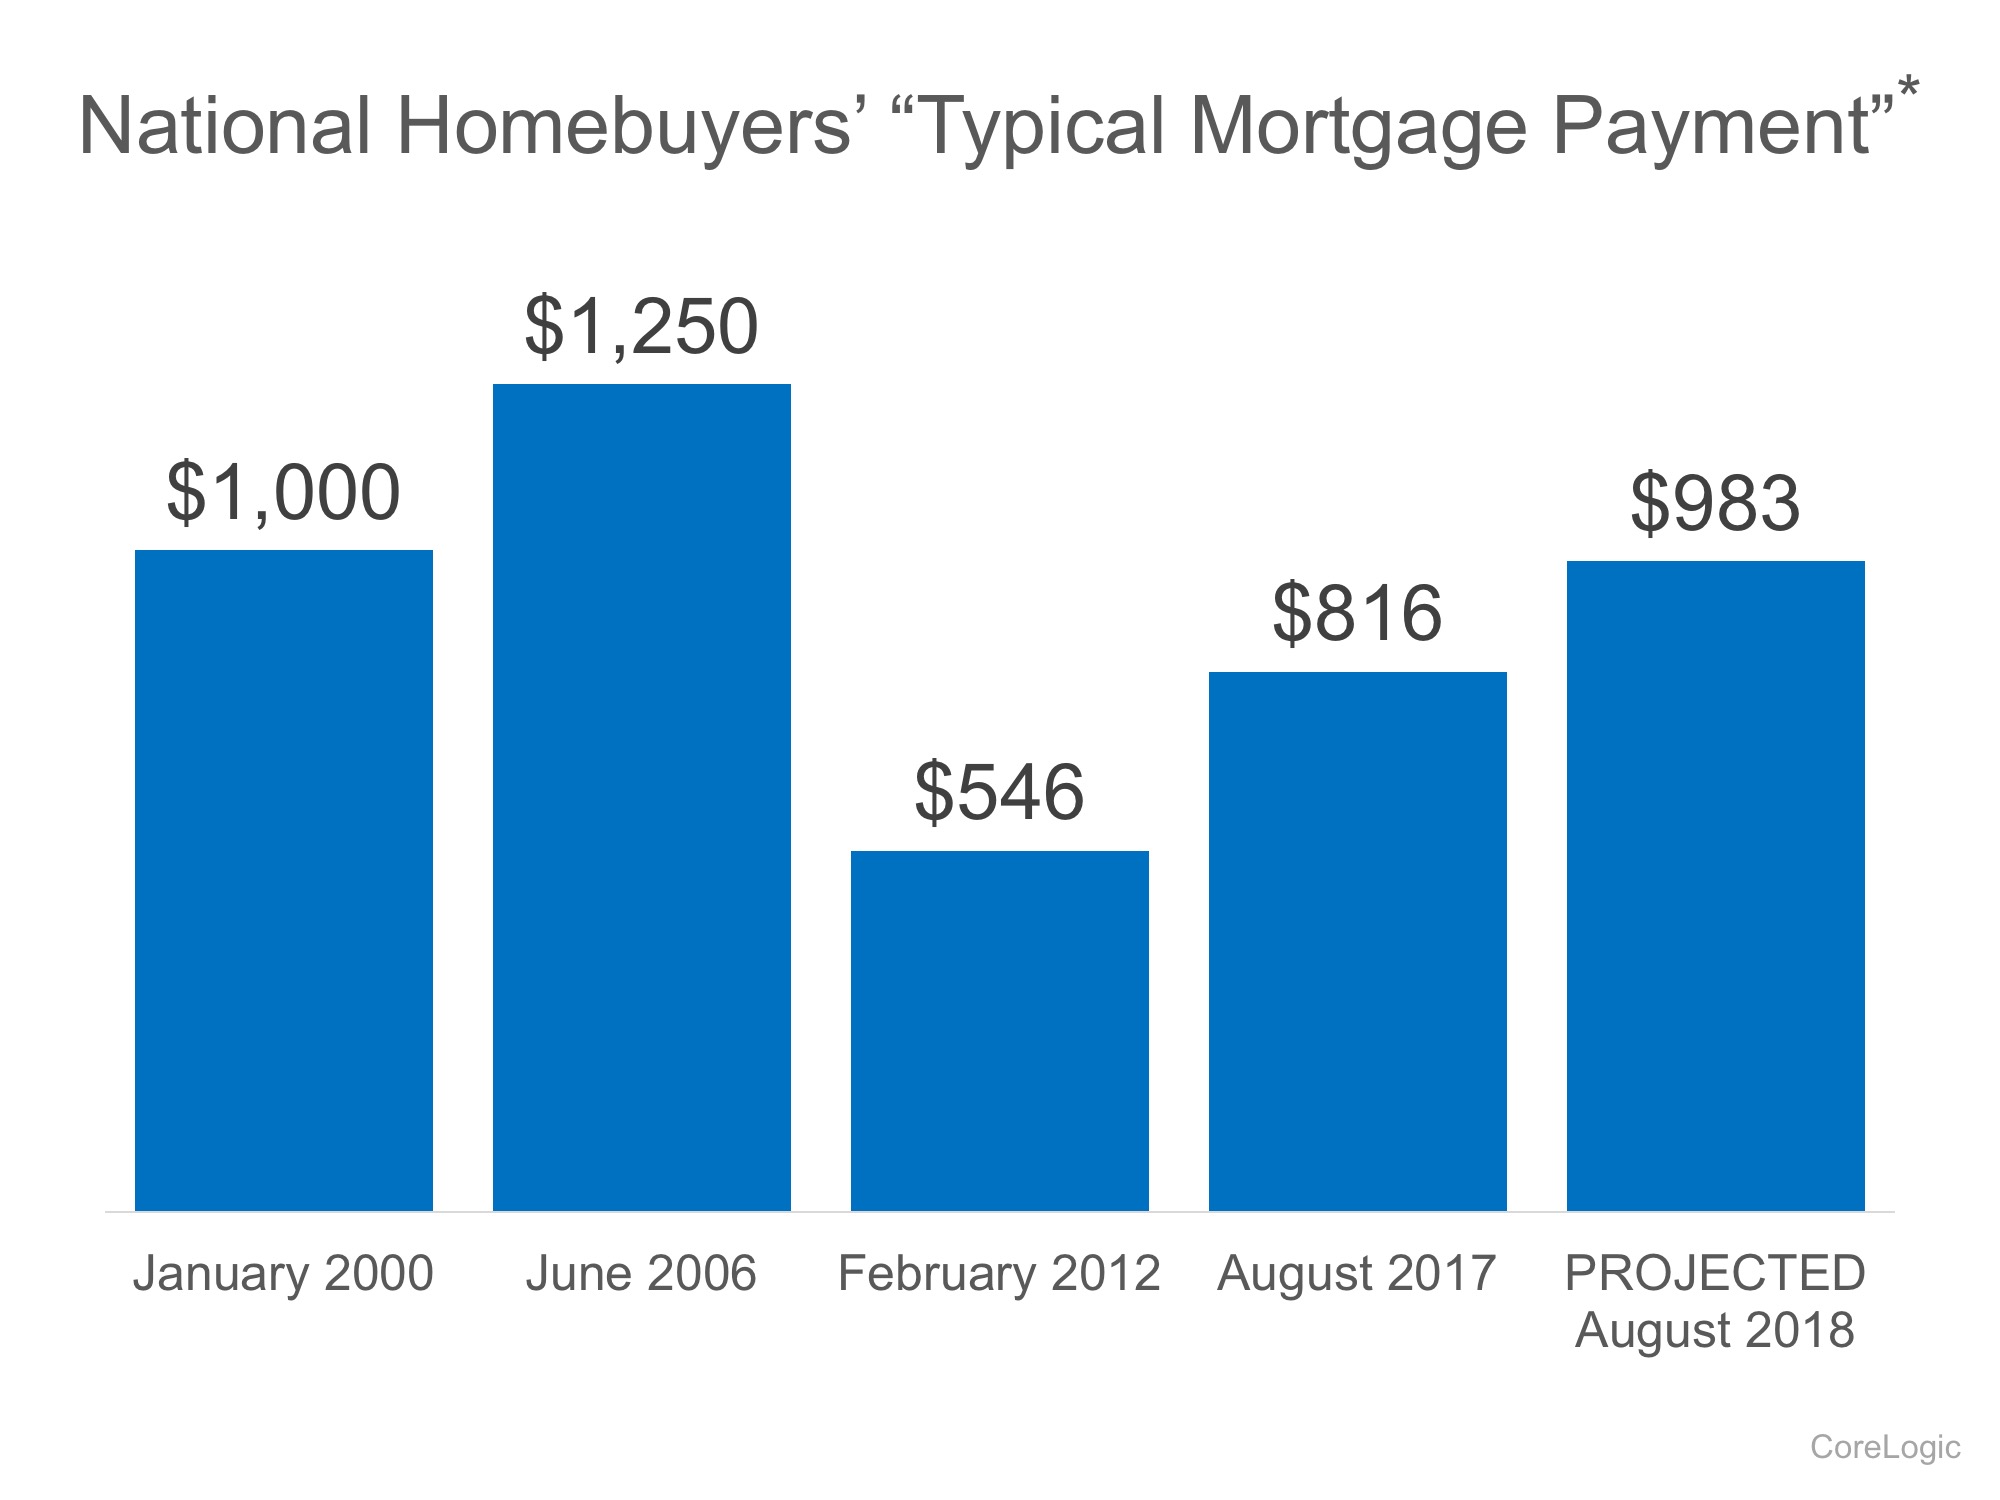
CoreLogic just published a report showing the National Homebuyers’ “Typical Mortgage Payment.” Here is a graph of their findings:
2 Charts That Show the Truth about Home Affordability | MyKCM
It reveals that, though a ‘typical’ housing payment was less expensive in 2012 (remember distressed properties), it is currently less expensive than it was in 2000 and is still projected to be lower next year than it was in 2000.

Bottom Line

Mark Fleming, Chief Economist at First American, explained it best:
“While borrowing power for the potential home buyer has fallen relative to the low point of 2012, it remains high today and will remain high next year, relative to the long run average. If you don’t want to rent anymore and are considering becoming a homeowner, even if mortgage rates rise next year, your borrowing power will remain strong by historic standards.”


Wednesday, April 5, 2017

Analysts reveal that foreclosures peaked in 2010, and have been on a consistent decline since then.

The Foreclosure Crisis: 10 Years Later

The Foreclosure Crisis: 10 Years Later | MyKCM
CoreLogic recently released a report entitled, United States Residential Foreclosure Crisis: 10 Years Later, in which they examined the years leading up to the crisis all the way through to present day.
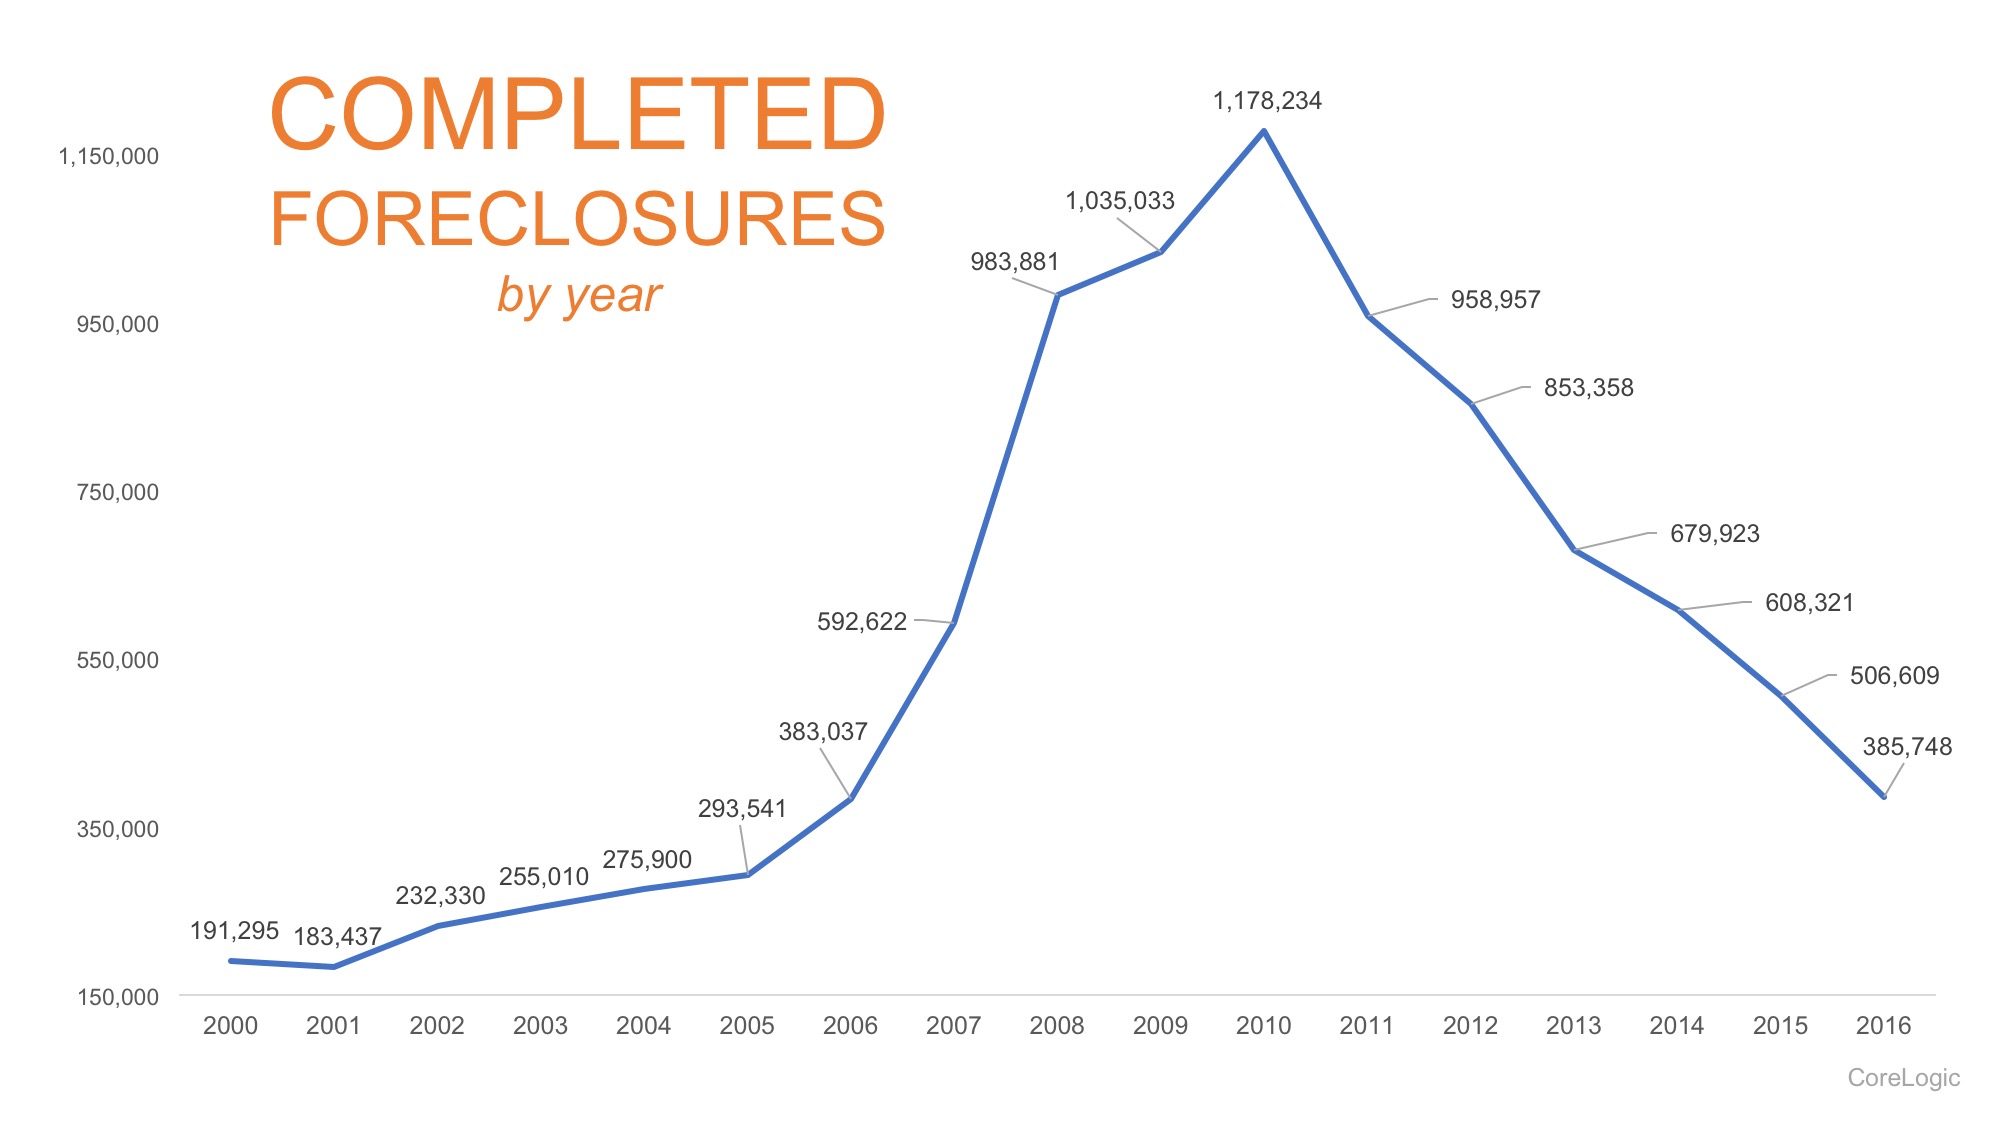
With a peak in 2010 when nearly 1.2 million homes were foreclosed on, over 7.7 million families lost their homes throughout the entire foreclosure crisis.
Dr. Frank Nothaft, Chief Economist for CoreLogic, had this to say,
“The country experienced a wild ride in the mortgage market between 2008 and 2012, with the foreclosure peak occurring in 2010. As we look back over 10 years of the foreclosure crisis, we cannot ignore the connection between jobs and homeownership. A healthy economy is driven by jobs coupled with consumer confidence that usually leads to homeownership.”
Since the peak, foreclosures have been steadily on the decline by nearly 100,000 per year all the way through the end of 2016, as seen in the chart below.
The Foreclosure Crisis: 10 Years Later | MyKCM
If this trend continues, the country will be back to 2005 levels by the end of 2017.

Bottom Line

As the economy continues to improve, and employment numbers increase, the number of completed foreclosures should continue to decrease.

Monday, October 31, 2016

Prepare yourself properly, before you begin the home buying process, and you will find that it isn't scary at all!


Taking the Fear out of the Mortgage Process


Taking the Fear out of the Mortgage Process | MyKCM
A considerable number of potential buyers shy away from jumping into the real estate market due to their uncertainty about the buying process. A specific cause for concern tends to be mortgage qualification.

For many, the mortgage process can be scary, but it doesn’t have to be!

In order to qualify in today’s market, you’ll need to have saved for a down payment (the average down payment on all loans was 11% last month, with many buyers putting down 3% or less), a stable income and good credit history.
Throughout the entire home buying process, you will interact with many different professionals, all of which perform necessary roles. These professionals are also valuable resources for you.
Once you’re ready to apply, here are 5 easy steps that Freddie Mac suggests to follow:
  1. Find out your current credit history & score – even if you don’t have perfect credit, you may already qualify for a loan. The average FICO Score of all closed loans in September was 731, according to Ellie Mae.
  2. Start gathering all of your documentation – income verification (such as W-2 forms or tax returns), credit history, and assets (such as bank statements to verify your savings).
  3. Contact a professional – your real estate agent will be able to recommend a loan officer that can help you develop a spending plan, as well as determine how much home you can afford.
  4. Consult with your lender – he or she will review your income, expenses, and financial goals in order to determine the type and amount of mortgage you qualify for.
  5. Talk to your lender about pre-approval – a pre-approval letter provides an estimate of what you might be able to borrow (provided your financial status doesn’t change), and demonstrates to home sellers that you are serious about buying!

Bottom Line

Do your research, reach out to professionals, stick to your budget, and be sure that you are ready to take on the financial responsibilities of becoming a homeowner.

Friday, September 23, 2016

Good news for the housing market - preforeclosure levels are back to what they were before the housing crisis hit...


Foreclosure Rate Drops to Pre-Crisis Levels


Foreclosure Rate Drops to Pre-Crisis Levels [INFOGRAPHIC] | MyKCM
Some Highlights:
  • Only 2.9% of homes are in serious delinquency, down 17.1% from July 2015.
  • This is the 57th consecutive month with a year-over-year decline.
  • The national foreclosure rate has returned to August 2007 levels, at only 0.9%.

Wednesday, May 18, 2016

Are the number of foreclosures decreasing in your marketplace?

Are Foreclosures Increasing or Decreasing?

20160518-Share-STM
Recently, there has been a lot of talk about the size of the foreclosure inventory in the nation. There has been some speculation that distressed property inventories are about to skyrocket. Today, we want to reveal what is actually taking place in this segment of the housing market.
CoreLogic, in their most recent National Foreclosure Report, reported that foreclosure inventory has decreased by 23.2% since this time last year. The report also showed that foreclosure inventory has decreased in 49 of the 50 states and that 45 states have posted a year-over-year, double-digit decline (see chart below).
Are Foreclosures Increasing or Decreasing? | Simplifying The Market
Other findings in the report:
  • The Seriously Delinquent Rate (homeowners more than 90 days behind in their mortgage payment) is 3.1% which is the lowest level since November 2007
  • The Foreclosure Rate is 1.1% which is also the lowest level since November 2007
  • This was the 53rd consecutive month that showed a decline in the Foreclosure Rate

Bottom Line

Though foreclosures do remain in the market, the number is dramatically decreasing. The fact that mortgage delinquency rates are also decreasing means the worst of the foreclosure crisis is in the rearview mirror.